


Economy & Banking Industry Review
Malaysia's economic growth momentum was sustained (2012: 5.6%; 2011: 5.1%) as resilient domestic demand offset weak external demand. Government, business and consumer spending were all underpinned by an accommodative monetary policy, targeted fiscal stimulus, and the rollout of infrastructure and investment projects under the Regional Development Corridors (e.g. Iskandar Malaysia) and the Economic Transformation Programme (e.g. the Mass Rapid Transit and oil and gas projects).
Malaysia: GDP by Demand and Sectors
| Growth (% change) | ||
|---|---|---|
| 2011 | 2012 | |
| Real GDP | 5.1 | 5.6 |
| By Demand | ||
| Private Consumption Expenditure | 7.1 | 7.7 |
| Government Consumption Expenditure | 16.1 | 5.0 |
| Gross Fixed Capital Formation | 6.5 | 19.9 |
| Exports of Goods & Services | 4.2 | 0.1 |
| Imports of Goods & Services | 6.2 | 4.5 |
| By Sectors | ||
| Agriculture, Forestry & Fishing | 5.9 | 0.8 |
| Mining & Quarrying | (5.7) | 1.4 |
| Manufacturing | 4.7 | 4.8 |
| Construction | 4.6 | 18.5 |
| Services | 7.0 | 6.4 |
Source: Department of Statistics
In contrast, Singapore's economic growth slumped (2012: 1.3%; 2011: 5.2%) as the global economic slowdown took its toll on an economy that is nearly one-third driven by net external demand, and in turn had a knock-on effect on key economic sectors like manufacturing and services as well as consumer spending.
Singapore: GDP by Demand & Sectors
| Growth (% change) | ||
|---|---|---|
| 2011 | 2012 | |
| Real GDP | 5.2 | 1.3 |
| By Demand | ||
| Private Consumption Expenditure | 4.6 | 2.2 |
| Government Consumption Expenditure | 0.5 | (3.6) |
| Gross Fixed Capital Formation | 6.3 | 6.6 |
| Export of Goods and Services | 3.5 | 0.3 |
| Import of Goods and Services | 3.6 | 3.2 |
| By Sectors | ||
| Manufacturing | 7.8 | 0.1 |
| Construction | 6.3 | 8.2 |
| Services | 4.6 | 1.2 |
Source: Department of Statistics
Meanwhile, Indonesia's robust growth continued as the economy clocked its third successive year of above-6% expansion in real GDP (2012: 6.2%; 2011: 6.5%) on stronger domestic demand especially consumer spending and investment which offset a sharp slowdown in export growth.
Indonesia: GDP by Demand and Sectors
| Growth (% change) | ||
|---|---|---|
| 2011 | 2012 | |
| Real GDP | 6.5 | 6.2 |
| By Demand | ||
| Private Consumption Expenditure | 4.7 | 5.3 |
| Government Consumption Expenditure | 3.2 | 1.2 |
| Gross Fixed Capital Formation | 8.8 | 9.8 |
| Export of Goods and Services | 13.6 | 2.0 |
| Import of Goods and Services | 13.3 | 6.6 |
| By Sectors | ||
| Agriculture, Livestock, Forestry and Fisheries | 3.4 | 4.0 |
| Mining and Quarrying | 1.4 | 1.5 |
| Manufacturing | 6.1 | 5.7 |
| Electricity, Gas and Water Supply | 4.8 | 6.4 |
| Construction | 6.6 | 7.5 |
| Services | 8.5 | 7.7 |
Source: CEIC
Outlook For 2013
In 2013, global economic growth is expected to stabilise at 3.4% on the back of sustained recovery in the US, the gradual alleviation of the Eurozone crisis which should lift the economy and a pick-up in world trade volume. All this is positive for the Asian economies. China is expected to achieve a more sustainable expansion as the new leadership focuses on economic reforms and on moving away from investment and credit-driven growth to consumption and income-driven growth.
Global Real GDP
| % change | 2010 Actual | 2011 Actual | 2012E | 2013E |
|---|---|---|---|---|
| Consensus/Maybank | ||||
|
|
|
|
|
|
|
|
|
|
|
9.5 | 8.0 | 6.2 | 6.7 |
| World Trade Volume | 12.6 | 5.9 | 3.8 | 5.5 |
Sources: IMF, Consensus, Maybank (forecasts for US, Eurozone, China, India, Singapore, ASEAN-5)
Malaysia
The Malaysian economy is projected to expand by 5.3% in 2013 (2012: 5.6%) as domestic demand continues to support growth momentum, with another year of targeted fiscal stimulus combined with progress in the implementation of key infrastructure and investment projects. Net external demand, however, will remain a drag though less severe than in 2012 as import growth again outpaces export growth.
Singapore
Singapore's real GDP growth is expected to rise to 3% in 2013 (2012: 1.3%) as improvements in the external environment benefit the trade-related sectors of the economy. In addition, the tight labour market conditions and stricter rules on foreign workers, coupled with the probable continuation of the gradual Singapore Dollar appreciation policy, are likely to spur business investment, and to enhance productivity and efficiency. The 2013 budget is predicted to include measures to boost domestic demand and facilitate economic restructuring. These should counter the soft property/real estate sector.
Indonesia
Indonesia's growth momentum is expected to continue, with the economy expanding by 6.7% (2012: 6.2%). Domestic demand will remain the key driver, underpinned by consumer spending boosted by the minimum wage increase. In addition, investment growth should be sustainable on the back of a rise in foreign direct investment, tapping into Indonesia's potential as the next major emerging economy, as well as the need to expand capacity to address the infrastructure bottlenecks and to improve and modernise existing capacity.
Banking Sector Review 2012
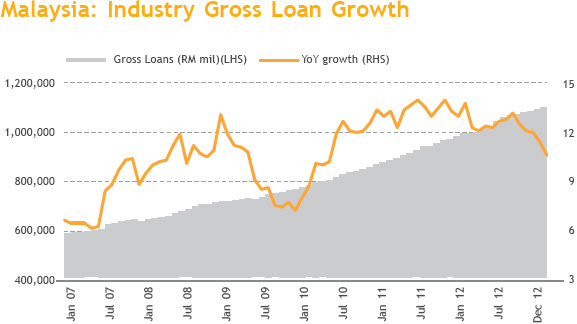
In 2012, banking system loans expanded at a rate of 10.4% year-on-year, down from 13.6% year-on-year in 2011. Household lending increased by 11.4% year-on-year while non-household loan growth, which had gathered pace in the first half of 2012 and accelerated to a peak of 14.4% year-onyear in July 2012, slid to just 9.2% year-on-year in December 2012. Household loans accounted for 55.6% of total industry loans as at the end of 2012.Business loan growth slowed in the second half of 2012 due mainly to external headwinds which contributed to slower GDP growth throughout the region. Nevertheless, with projects under the Economic Transformation Programme (ETP) taking off, much of the funding requirement for larger infrastructure projects flowed through the debt capital market, with private debt securities (PDS) issuances rising a whopping 74% year-onyear to a record RM121 billion in 2012.
Household loans growth in 2012 was led by non-residential property loan demand, which expanded at a robust pace of 19.5% year-on-year, and residential property lending, which was steady at 12.9% year-on-year. Vehicle financing growth was a stable 7.6%, but there was a more pronounced slowdown in credit card and personal financing, in response to Bank Negara's responsible lending guidelines.
Total deposits grew at a slower pace of 8.4% year-on-year as at end-2012 but there was sufficient liquidity, with an industry loan-to-deposit ratio of 82.1%. Current Account and Savings Account (CASA) deposits rose at a faster pace of 10.3% year-on-year and accounted for 25.8% of total deposits as at end-2012, versus 25.3% as at end-2011. Deposit composition improved with core retail deposits rising further to account for a higher 36.2% of total deposits versus 35.3% as at end-2011.
The fundamentals of the banking system strengthened as the industry's gross non-performing loan ratio hit an all-time low of 2.0% while loan loss coverage was a comfortable 100.9%. Levels of capitalisation were healthy with core capital and risk-weighted capital ratios of 13.4% and 15.2% respectively as at end-2012.
Banking Sector Outlook Malaysia 2013
Against the backdrop of stable economic growth this year, we project loan growth to hold up at 10-11% with resilient though more moderate household loan demand. Business loan demand, meanwhile, should gather momentum as the global economy expands at a faster pace. As at the end of September 2012, only RM21 billion out of RM212 billion worth of committed ETP projects had been actualised and we expect a flow-through of such activity into 2013 to sustain loan growth momentum as well as demand for PDS.
Preserving margins remains a challenge in 2013, as the ongoing substitution of the mortgage book with newer, lower-yielding loans, is shaving yields, while the competition for funds remains stiff. Overall, however, we expect less margin compression in 2013 than in the previous year, given that lending rates would appear to have stabilised. Interest margins could potentially be supported as well by a possible hike in policy rates towards year end, if inflationary pressure persists.
Credit costs were exceptionally low in 2012 on the back of strong recovery efforts and improvements in asset quality. We see such costs trending upwards in 2013 but rates should still be fairly benign in an environment of stable asset quality.
With Basel III capital requirements to comply with, capital preservation has become a buzzword, and more banks have turned to dividend reinvestment plans or reduced their dividend payout policy as a means of bolstering capital ratios. Future capital-raising exercises in the industry cannot be ruled out as banks look to further expand their capital base.
M&A activity is likely to be an ongoing theme in 2013 since some of the deals that were announced in 2012 are still pending resolution. Regional expansion remains a key aspiration but this will have to be balanced against the capital requirements of Basel III.
