


Maybank Share
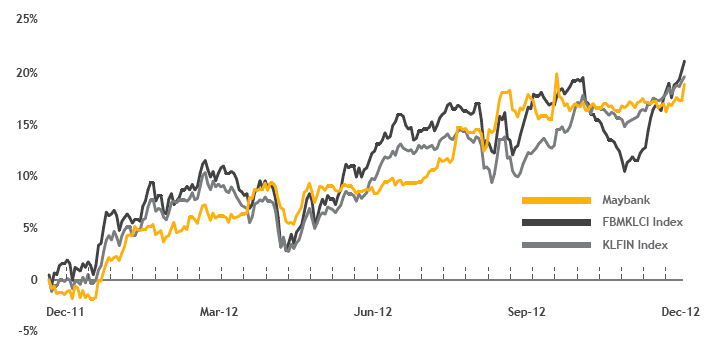
- In 2012, Maybank's share price movement mirrored the FBM KLCI Index, reaching a high of RM9.28 (17 October 2012) compared to the broader Index's all-time high of 1,688.95 points on 31 December 2012.
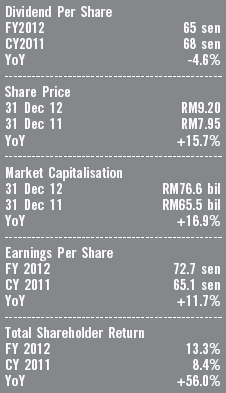
- Maybank's share price increased 19.0% from RM7.73 on 2 January 2012 to RM9.20 on 31 December 2012. Its performance outperformed that of the FBM KLCI Index which increased by 11.6% and the KL Finance Index which increased by 14.1%.
- At the start of the year the global recovery was threatened by intensifying strains in the Eurozone and fragilities elsewhere due to the rise in sovereign yields, the effects of bank deleveraging on the real economy, and the impact of additional fiscal consolidation.
- Hence, financial conditions deteriorated, growth prospects dimmed and downside risks escalated. This amplified investors' fears over the uncertainty of global markets, pushing the FBM KLCI Index and Maybank share price to lows of 1,504.22 points (4 January 2012) and RM7.59 on 27 January 2012.
- This was followed by a rebound on the back of improved activity in the United States and better policies in the Eurozone. The rebound momentum was also sustained due to the improved supply chains in Thailand (after floods) leading to stronger industrial production and trade in various Asian economies. In addition, reconstruction continued to boost output in Japan.
Maybank Share Price vs Benchmark
Total Shareholder Return (TSR)
TSR is the measure of our enhancement of shareholder value that measures total return arising from capital gains (share price increase) and dividends.
| FY07 | FY08 | FY09 | FY10 | FY11 | CY11 | FY12 | |
|---|---|---|---|---|---|---|---|
| Maybank | 19.30% | -21.43% | -3.88% | 31.69% | 28.13% | 8.37% | 13.30% |
| FBM KLCI Index | 54.30% | -8.20% | -5.26% | 26.09% | 24.83% | 4.45% | 8.70% |
| Bursa Malaysia Finance Index | 53.23% | -19.79% | 1.70% | 43.81% | 32.86% | 4.58% | 13.90% |
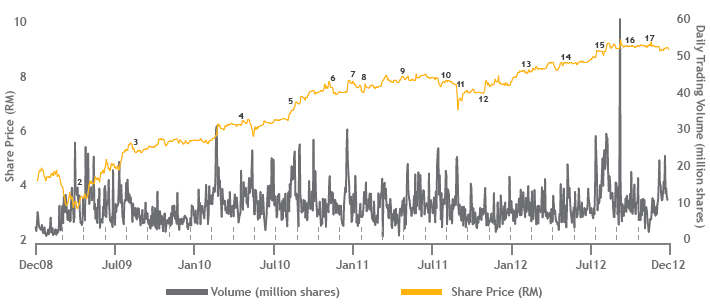
Maybank Share Price and Volume Performance

Dividend And Dividend Reinvestment Plan
For 2012, the Board of Directors proposes a gross dividend of 33 sen which translates to a dividend payout ratio of 74.7%.
The Group will continue to reward shareholders via a high dividend payout ratio while being prudent in preserving capital through the introduction of the Dividend Reinvestment Plan (DRP). The DRP exercises have achieved high reinvestment rates of 88.6%, 91.1%, 86.1%, 88.5% and 88.2% in the five DRPs so far, reflecting shareholders' confidence in Maybank.
The DRP will continue to be an integral part of Maybank's strategy to preserve equity capital whilst providing healthy dividend income to shareholders.

Economic Profit
- The Putrajaya Committe on GLC High Performance (PCG) spearheads the GLC Transformation Programme to develop high-performing entities for the future prosperity of the country.
- Economic Profit is a key measurement of shareholder value creation, proposed by the PCG Secretariat to show a company's return over and above its cost of capital. Maybank has tracked the performance of its Economic Profit since 2005.
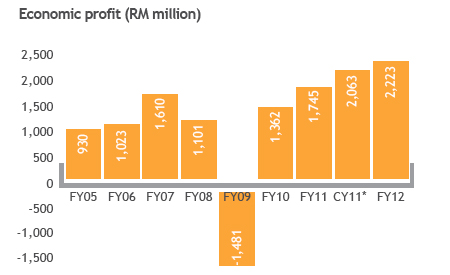
- For 2012, Maybank's Economic Profit increased 7.8% to RM2.22 billion from RM2.06 billion in the previous calendar year. The increase was attributable to higher profit for the year despite the expanded equity base.
Shareholder Analysis
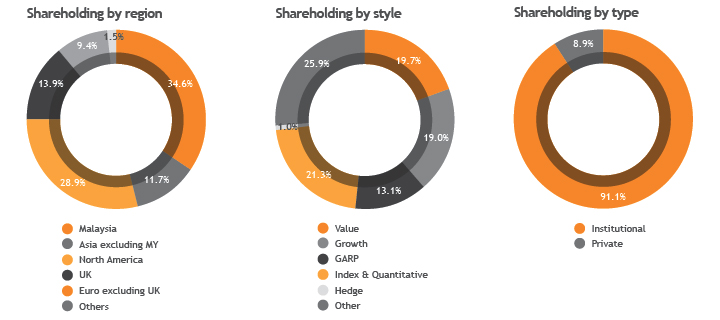
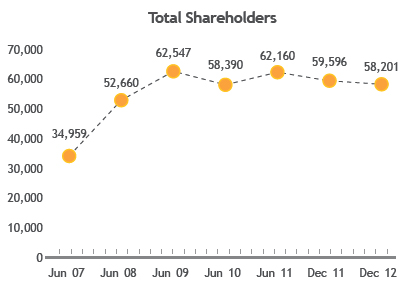
- With over 58,000 shareholders around the globe, Maybank has a diversified shareholder base.
- Analysis of the institutional shareholder structure (excluding Substantial Shareholders) shows that 34.6% of the shareholding comes from Asia, followed by 28.9% from North America, 13.9% from the UK, 9.4% from Europe (excluding the UK), and 1.5% from other geographical locations.
- Maybank shares are mostly held by institutional investors, (91.1%), while private investors hold the balance (8.9%).
- Analysis of shareholders by style shows that 19.7% are value-oriented funds, 19.0% are growth oriented, 13.1% are GARP funds, 21.3% are Index & Quantitative funds, 1.0% are Hedge funds and 25.9% are made up of other investment styles.
- Foreign shareholding increased to 19.5% in December 2012 from 13.3% a year before.
American Depository Receipts (ADRs)
To diversify and increase US ownership and improve Maybank's profile in the US market, since 2005 Maybank has also been traded in the US through a NYSE-listed sponsored ADR facility with The Bank of New York Mellon as the depository. The ADRs are traded on the New York Stock Exchange under the ticker MLYBY US on Bloomberg and MLYBY.PK on Reuters.
Credit Rating
- Maybank continued to retain its credit ratings on par with Malaysia's sovereign rating during the financial period with strong fundamentals.
- The outlook for the long-term credit ratings for Maybank was maintained as Stable throughout the financial period by all five rating agencies.
- Maybank is regularly in contact with its credit rating agencies as well as regulators to ensure continued adoption of prudent capital management practices, and remains committed to maintaining its investment grade credit ratings.
| Rating Agency | Rating Classification | Ratings Received |
|---|---|---|
| Moody's Investors Service |
Long-term Foreign Currency Bank Deposit/Outlook Short-term Foreign Currency Bank Deposit Long-term Local Currency Bank Deposit/Outlook Short-term Local Currency Bank Deposit Bank Financial Strength Rating/Outlook Baseline Credit Assessment Adjusted Baseline Credit Assessment Jr Subordinate |
A3/Stable P-2/Stable A1/Stable P-1/Stable C/Stable (a3)/Stable (a3)/Stable Baa2/Stable |
| Standard & Poor's |
Long-term counterparty Short-term counterparty Certificate of Deposit Preferred Stock (1 Issue) Subordinated (2 Issues) Outlook Senior Unsecured (1 Issue) |
A- A-2 A BBB BBB+ Stable A- |
| AFitch Ratings |
Foreign Long-term Issuer Default Rating Local Long-term Issuer Default Rating Viability Rating Support Rating Support Rating Floor USD and SGD Sub Debt SGD Tier 1 Capital Securities |
A-/Stable A-/Stable a- 2 BBB BBB+ BB+ |
| RAM Ratings |
Long-term Financial Institution Ratings Short-term Financial Institution Ratings Subordinated Bonds Innovative Tier-1 Capital Securities Non-Innovative Tier-1 Capital Securities Tier-2 Capital Subordinated Note Programme Subordinated Note Programme Outlook (Long Term) |
AAA P1 AA1 AA2 AA2 AA1 AA1 Stable |
| MARC |
Long-term Financial Institution Ratings Short-term Financial Institution Ratings Outlook |
AAA MARC-1 Stable |
Share Related Key Figures
| FY2007 | FY2008 | FY2009 | FY2010 | FY2011 | FP2011 | FY2012 | |
|---|---|---|---|---|---|---|---|
| Market Capitalisation (RM billion) | 46.7 | 34.4 | 41.8 | 53.5 | 66.9 | 65.5 | 76.6 |
| Total Shareholder Return, TSR (%) | 19.3 | -21.4 | -3.9 | 31.7 | 28.1 | -0.16 | 13.3 |
| Dividend per share (sen) | 57.5 | 44.0 | 8.0 | 55.0 | 60.0 | 36.0 | 65.0 |
| Dividend yield (%) | 6.7 | 7.4 | 1.4 | 7.3 | 6.7 | 4.3 | 6.2 |
| Closing Price, 31 Dec (RM) | 8.62 | 6.33 | 5.9 | 7.56 | 8.94 | 8.58 | 9.20 |
| Average share price (RM) | 8.46 | 8.00 | 5.25 | 6.94 | 8.60 | 8.45 | 8.50 |
| Highest closing share price (RM) | 9.84 | 9.20 | 7.14 | 7.72 | 9.29 | 8.99 | 9.20 |
| Lowest closing share price (RM) | 7.47 | 6.33 | 3.57 | 5.60 | 7.53 | 7.51 | 7.59 |
| Basic EPS (sen) | 58.5 | 53.3 | 12.0 | 53.9 | 61.4 | 32.4 | 72.7 |
Dividend History
| Dividend per share (sen) | Declaration | Ex-Date | Record | Payment Date | |||
|---|---|---|---|---|---|---|---|
| Actual | Adjusted for capital changes |
||||||
| FY2007 | Interim | 40.0 | 28.7 | 21 Feb 2007 | 10 Apr 2007 | 12 Apr 2007 | 26 Apr 2007 |
| Final | 40.0 | 28.7 | 29 Aug 2007 | 30 Oct 2007 | 1 Nov 2007 | 15 Nov 2007 | |
| Total | 80.0 | 57.5 | |||||
| FY2008 | 1st Interim | 17.5 | 12.6 | 15 Nov 2008 | 31 Dec 2007 | 3 Jan 2008 | 16 Jan 2008 |
| 1:4 Bonus | 24 Jan 2008 | 18 Feb 2008 | 20 Feb 2008 | 20 Feb 2008 | |||
| 2nd Interim | 15.0 | 13.5 | 20 Feb 2008 | 24 Mar 2008 | 26 Mar 2008 | 7 Apr 2008 | |
| Final | 20.0 | 18.0 | 27 Aug 2008 | 7 Oct 2008 | 9 Oct 2008 | 21 Oct 2008 | |
| Total | 52.5 | 44.0 | |||||
| FY2009 | 9:20 Rights | 1 Mar 2009 | 31 Mar 2009 | 2 Apr 2009 | - | ||
| Final | 8.0 | 8.0 | 25 Aug 2009 | 13 Oct 2009 | 15 Oct 2009 | 27 Oct 2009 | |
| Total | 8.0 | 8.0 | |||||
| FY2010 | Interim | 11.0 | 11.0 | 9 Feb 2010 | 2 Mar 2010 | 4 Mar 2010 | 16 Mar 2010 |
| Final | 44.0 | 44.0 | 11 Oct 2010 | 18 Nov 2010 | 22 Nov 2010 | 20 Dec 2010 | |
| Total | 55.0 | 55.0 | |||||
| FY2011 | Interim | 28.0 | 28.0 | 31 Mar 2011 | 12 Apr 2011 | 14 Apr 2011 | 12 May 2011 |
| Final | 32.0 | 32.0 | 22 Aug 2011 | 25 Nov 2011 | 30 Nov 2011 | 28 Dec 2011 | |
| Total | 60.0 | 60.0 | |||||
| FP2011 | Final | 36.0 | 36.0 | 23 Feb 2012 | 27 Apr 2012 | 2 May 2012 | 4 Jun 2012 |
| Total | 36.0 | 36.0 | |||||
| FY2012 | Interim | 32.0 | 32.0 | 7 Sep 2012 | 20 Sep 2012 | 24 Sep 2012 | 25 Oct 2012 |
| Final | 33.0 | 33.0 | 21 Feb 2012 | | | | |
| Total | 65.0 | 65.0 | |||||
Other Information
Financial Year End
31 December
Foreign Shareholding
Ticker Code
American Depository Receipts (ADR)
Share Registrar
Tricor Investor Services Sdn Bhd(formerly known as Tenaga Koperat Sdn Bhd)
Level 17, The Gardens North Tower
Mid Valley City, Lingkaran Syed Putra
59200 Kuala Lumpur
Malaysia.