


Key Performance Indicators
To assess the Group's performance and ensure that it meets its strategic objectives, the Group measures its progress against several key performance indicators (KPIs), as set out below:
| Headline KPIs | Achievement | PER AVERAGE** |
|---|---|---|
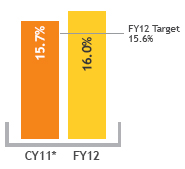
RETURN ON EQUITY (ROE) 15.6%ROE is defined as profit attributable to shareholders divided by the average shareholders' equity for the financial year. Shareholders' equity is made up of share capital, retained earnings and other reserves. |
16.0%Exceeded target on the back of higher net income, slower cost growth and improving asset quality. |
15.7% |
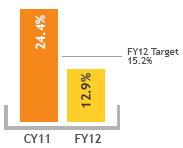
LOANS AND DEBT SECURITIES GROWTH 15.2%Loans and debt securities (financial assets) growth measures the total increase in gross loans and other debt or security issuances. |
12.9%Loans growth trended in line with industry, while debt securities growth was managed in tandem with market conditions. |
5.4% |
| Other KPIs | Achievement | PER AVERAGE** |
|---|---|---|
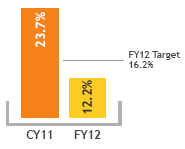
GROUP LOANS GROWTH 16.2%Group loans growth is defined as gross loans growth for Maybank Group. |
12.2%Due to slower industry loans growth in Malaysia and Singapore, the focus was to grow profitably in selected segments and manage asset quality. |
5.9% |
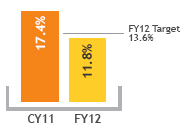
LOANS GROWTH MALAYSIA 13.6%Loans growth for Malaysia is defined as domestic gross loans growth i.e. in Malaysia only. |
11.8%Loans growth though behind target, was ahead of the industry's 10.4% growth. |
9.0% |
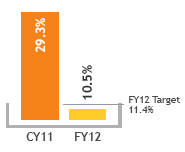
LOANS GROWTH SINGAPORE 20.9%Loans growth for Singapore defined as gross loans growth reported by Maybank Singapore in Singapore Dollars. |
10.5%Loans growth though behind target of 10.5% was slightly ahead of the industry's 10.4% growth. |
11.8% |
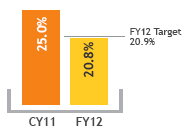
LOANS GROWTH INDONESIA 20.9%Defined as gross loans growth captured by BII, including its subsidiary WOM Finance, in Indonesian Rupiah. |
20.8%Loans growth was in line with target, with consumer growing 40.4% and non-consumer growing 12.1%. |
20.4% |
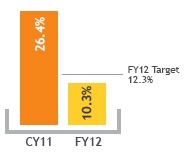
GROUP DEPOSITS GROWTH 12.3%Group deposit growth is defined as gross deposits growth for Maybank Group. |
10.3%Behind target due to stiffer competition. However, as the Group focused on improving deposit mix, Casa ratio improved to 35.1% (Dec 11: 33.6%). |
6.1% |
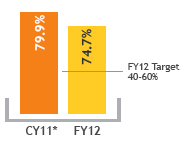
DIVIDEND PAYOUT RATIO 40-60%Maybank has a policy of paying dividends equivalent to between 40-60% of annual profit attributable to shareholders. |
74.7%Dividend payout ratio for 2012 of 74.7% surpassed the 40-60% policy rate. Dividend Reinvestment Plan (DRP) continues to strengthen the Group's capital base and achieves more than 80% acception rate (based on last 5 plans). |
6.1% |
| Long Term Targets by 2015 | Achievement | ON TRACK |
|---|---|---|
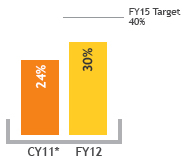
International contribution to Group profit before tax 40% |
30%PBT contribution from international operations increased with Singapore and Indonesia being the major contributors at 14.0% and 7.0% respectively. |
|
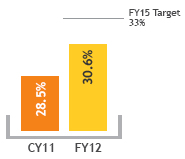
Islamic Financing to Maybank domestic loans 33% |
30.6%Islamic finance formed 30.6% of Maybank's domestic group loans and advances, on track with our target of 33%. |
* Unaudited
**
Peer average is based on YTD Q3 FY2012 results (annualised) of selected banks. Headline KPIs, group loans growth and group deposits growth are based on the
average for selected Singaporean and Malaysian banks with regional operations. Loans growth is based on the average annualised loans growth rate for loans
disbursed in the respective market by selected banks.