


Group Financial Review

"Our financial performance in 2012 reflects our commitment to create shareholder value. We achieved record PATAMI as a result of robust loan growth in the region, effective cost management whilst continuing to improve asset quality. As a result, we were able to deliver a 16.0% Return on Shareholders' Equity. During the financial year, the Bank also raised RM3.66 billion to strengthen its capital base and is now positioned for further growth. This landmark equity placement was the largest such transaction in corporate Malaysia."
Mohamed Rafique Merican
Group Chief Financial Officer
FY2012 highlights
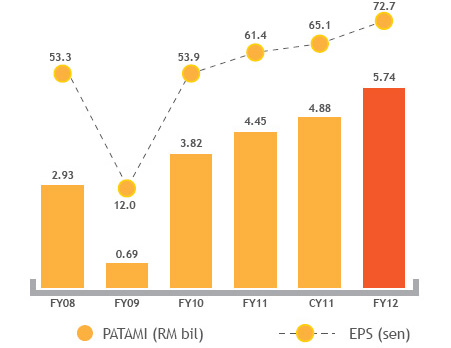
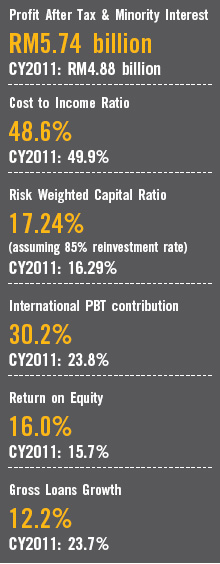
- Maybank Group delivered a record PATAMI of RM5.74 billion as well as superior shareholder value creation, with a ROE of 16.0% exceeding our headline KPI of 15.6%.
- This was the third year of double-digit earnings growth, which was driven by higher revenue growth, operating efficiency and improvements in asset quality.
- The rise in Group PBT and PATAMI was led by an overall 12.0% increase in revenue,from the year earlier, with domestic operations growing 10.5% and international growing 15.5%.
- International operations now contribute 30.2% of Group PBT, up from 23.8% in calendar year 2011, with Singapore's PBT now crossing the RM1.0 billion mark, and Indonesia's PBT rising 60% year-on-year to reach RM554 million.
- Maybank Islamic maintained its leadership position with a PBT of RM1.19 billion, up 24.9%; and total gross financing grew 18.3% to RM62 billion, representing 30.6% of Maybank's total domestic financing.
- The Group's balance sheet continued to strengthen with total assets of RM495 billion, and RWCR of 17.2% (assuming 85% reinvestment rate).
- Asset quality continued to improve with a Net Impaired Loans ratio of 1.09% and loan loss coverage of 105.6%.
- We are proposing a final net dividend of 28.5 sen per share, amounting to RM2.4 billion. This brings total FY2012 net dividend to RM4.29 billion representing a net dividend payout ratio of 74.7%.
Result summary for FY2012
| (RM'mil) | FY2012 | CY2011 | YoY |
|---|---|---|---|
| Net interest income | 8,480.7 | 7,624.4 | 11.2% |
| Net fund based income (Islamic Banking) | 1,699.4 | 1,560.9 | 8.9% |
| Net fund based income | 10,180.1 | 9,185.3 | 10.8% |
| Non-interest income | 5,273.7 | 4,499.7 | 17.2% |
| Fee based income (Islamic Banking) | 496.9 | 278.0 | 78.8% |
| Net income from insurance business | 652.4 | 856.0 | -23.8% |
| Net fee based income | 6,423.0 | 5,633.7 | 14.0% |
| Net income | 16,603.1 | 14,819.0 | 12.0% |
| Overhead expenses | (8,158.1) | (7,457.9) | 9.4% |
| Provisions | (702.9) | (626.0) | 12.3% |
| Operating profit | 7,742.1 | 6,735.1 | 15.0% |
| Profit before taxation and zakat | 7,894.6 | 6,875.2 | 14.8% |
| Profit after Tax and Minority Interest (PATAMI) | 5,744.7 | 4,884.0 | 17.6% |
| EPS - Basic (sen) | 72.7 | 65.1 | 11.7% |
- The Group continued to deliver strong financial performance in FY2012, with PBT and PATAMI increasing by 14.8% and 17.6% respectively while earnings per share was up by 11.7%. Growth in profit was contributed by higher net income which grew by 12.0%, while growth in overhead expenses was contained at 9.4%, reflective of improved operating efficiencies across the Group.
- Net income growth was supported by a 10.8% growth in net fund-based income (comprising net interest income and net fund-based income from Islamic banking) as a result of strong loans and deposits growth in our three home markets, in particular Indonesia, where loans growth came in at 20.8%. Net fee-based income grew higher at 14.0% arising from higher service charges and fees, brokerage fees, commission income, gains from investments and higher fee income from Islamic banking operations.
- Overhead expenses grew 9.4% in tandem with business expansion. The increase was mainly attributable to personnel costs which were higher by 14.9% and marketing expenses which were up 13.3% due to stronger business growth. As expenses grew at a slower rate than income growth, the Group was able to improve the cost to income ratio from 49.9% in the previous year to 48.6%.
- Total provisions increased by 12.3% mainly due to higher loan loss provisions for several newly impaired loans but were mitigated by write backs on impairment allowances in the corporate segment. The Group's loan loss coverage also strengthened significantly to 105.6% from 86.9% in CY2011.
- Asset quality continued to improve with net impaired loans ratio of 1.09% from 1.86% a year earlier.
- Earnings per share rose 11.7% to 72.7 sen compared to 65.1 sen in CY2011.
- The Board of Directors has proposed a final dividend of 18 sen per share less 25% taxation and a 15 sen single-tier dividend comprising a cash portion of 4 sen single-tier dividend and an electable portion of 29 sen (24.5 sen net per share), where the electable portion comprised 11 sen single-tier dividend and 18 sen franked dividend (net 13.5 sen).
- The total gross dividend for the year was 65 sen per share. Please refer to the Maybank Share in this annual report for more information on the dividend.
Business review
Revenue by business segment
| RM milion | FY2012 | CY2011 | YoY Change |
|---|---|---|---|
| Community Financial Services | 6,871 | 6,626 | 3.7% |
| Corporate Banking | 2,301 | 1,492 | 54.3% |
| Global Markets | 1,711 | 1,546 | 10.7% |
| Investment Banking | 1,279 | 888 | 44.0% |
| International Banking | 5,172 | 4,477 | 15.5% |
| Insurance & Takaful | 1,197 | 1,232 | -2.9% |
PBT by business segment
| RM milion | FY2012 | CY2011 | YoY Change |
|---|---|---|---|
| Community Financial Services | 3,024 | 3,247 | -6.9% |
| Corporate Banking | 1,989 | 1,241 | 60.3% |
| Global Markets | 1,474 | 1,264 | 16.6% |
| Investment Banking | 345 | 126 | 173.8% |
| International Banking | 2,293 | 1,649 | 39.3% |
| Insurance & Takaful | 698 | 790 | -11.6% |
In FY2012, most of the Group's business segments recorded positive growth in revenue and PBT. The highest growth came from the Global Banking (GB) segment, which recorded a 35% increase in revenue and 45% increase in PBT. These were contributed by the growth in the following units:
- Investment Banking, which is now a leading regional investment bank following the merger with Kim Eng Holdings, reported an increase of 173.1% in PBT. This was supported by a 44% increase in revenue following participation in major IPOs, and debt and equity capital market deals.
- Corporate Banking PBT rose sharply by 60.3% to RM1.99 billion as a result of strong growth in Term Loans (+25.4%) while the division maintained a healthy position in the trade finance market.
- Global Market recorded a growth of 16.5% in PBT on the back of a 10.7% increase in revenue compared to the previous year. This was supported by the expanded global market capabilities across the region.
- PBT for international operations saw a robust growth of 39.1% on higher revenue as a result of our business expansion in South East Asia. Maybank Singapore's PBT crossed the RM1 billion mark whilst Maybank BII made a significant contribution to PBT of RM526 million.
- The Group's CFS sector recorded lower PBT from the earlier year, that was impacted by the reclassification of SME and business banking accounts to GB in 2011. Without the transfer of these accounts to GB, CFS would have recorded higher revenue in 2012.
- Insurance, Takaful & Asset Management registered a normalised growth in revenue and PBT of 13.6% and 14.2% respectively in FY2012. Net insurance and takaful income in 2011 included 18 months of actuarial surplus transfer as there were two financial year end periods in line with the Group's transition from a June financial year end to a December financial year end. There was also a one-off adjustment in December 2011 due to a change in the actuarial liability valuation basis.
Composition of Group revenue and PBT by business segment
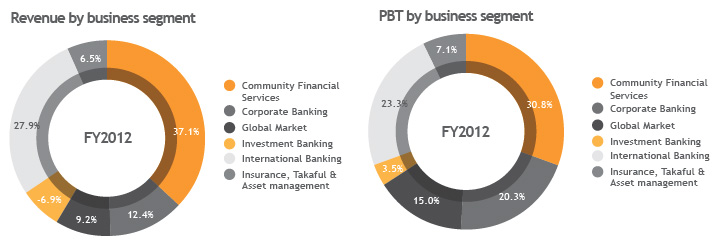
- Group revenue consisted of 37.1% from Community Financial Services, 28.6% from Global Banking (comprising Corporate Banking, Global Market and Investment Banking), 27.9% from International operations and 6.5% from Insurance, Takaful & Asset Management.
- The Group's PBT consisted of 30.8% of Community Financial Services, 38.8% of Global Banking (comprising Corporate Banking, Global Market and Investment Banking), and 7.1% of Insurance, Takaful & Asset Management.
Group revenue and PBT by Geography
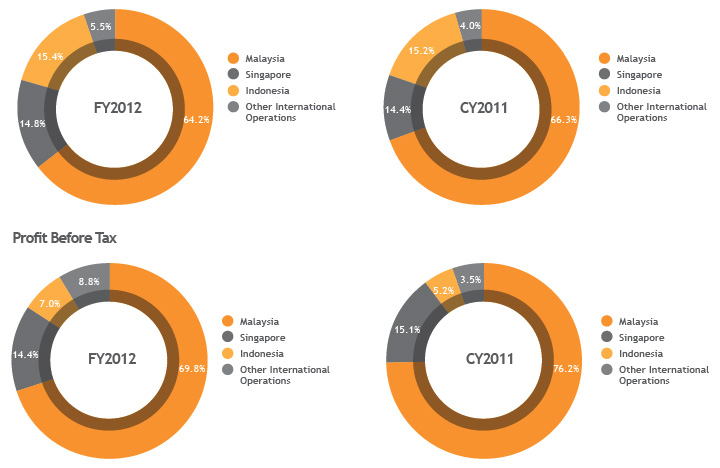
- Domestic operations accounted for 64% of the Group's revenue and 70% of its PBT in FY2012. Overseas operations, which made up the remaining portion, increased its contribution to 36% and 30% of revenue and PBT from 30% and 24% respectively.
Balance sheet continued to strengthen
- The Group's total assets expanded by RM43.3 billion or 9.6% to RM494.9 billion from RM451.6 billion as at 31 December 2011. The strong growth in total assets was attributed to higher growth in loans, advances and financing, bank's securities and deposit placements with financial institutions.
- Total net loans grew RM35.6 billion or 12.9% year-on-year to RM311.8 billion from RM276.2 billion on the back of strong growth in Indonesia, Singapore and other international markets, as well as Islamic and conventional financing in Malaysia which was above industry growth rates.
- Deposits from customers grew by RM32.5 billion or 10.3% to RM347.2 billion from RM314.7 billion in the corresponding year mainly attributable to 14.0% growth in international markets, outpacing that in Malaysia which came in at 8.5%.
- As a result of higher loans growth relative to customer deposits growth, the Group's loan-to-deposit ratio rose from 87.8% as at December 2011 to 89.8%.
- Shareholders' funds before non-controlling interest posted a
growth of RM7.8 billion or 22.7% year-on-year to RM42.2
billion from RM34.4 billion. The increase in shareholders'
funds was attributable to the Bank's issuance of new
ordinary shares during FY2012 pursuant to the following:
Issuance of ordinary shares pursuant to Maybank's ESS
- Issuance of ordinary shares pursuant to Maybank's Dividend Reinvestment Plan (DRP)
- Issuance of ordinary shares pursuant to ESOS Transfer Fund
- Issuance of ordinary shares pursuant to Private Placement
Stronger loans growth in most business segments and key home markets
| FY2012 | CY2011 | YoY | |
|---|---|---|---|
|
|
|
|
|
|
|
|
|
|
|
|
| Other markets | 20.6 | 18.4 | 12.2% |
| Group Gross Loans^ (RM billion) | 317.3 | 282.8 | 12.2% |
Including Islamic loans sold to Cagamas and excluding unwinding of interest
- The Group's gross loans increased by RM34.5 billion or 12.2% to RM317.3 billion as at December 2012 as compared to the preceding year of RM282.8 billion as at December 2011. Loans from international operations grew at a faster rate of 12.9%, versus domestic loans at 11.8%, reflecting the growth prospects in the region. Within the international segment, Indonesia recorded a growth of 20.8% in loans, while the Group's operations in Singapore boosted loans by 10.5%. International loans made up 37% of the Group's total gross loans at the end of 2012.
Domestic loans
| Loans growth in RM billion | FY2012 | CY2011 | YoY |
|---|---|---|---|
|
|
|
|
|
|
|
|
| Global Banking (Corporate) | 64.5 | 57.8 | 11.5% |
| Total Domestic | 199.8 | 178.6 | 11.8% |
- In Malaysia, loans grew at 11.8%, ahead of the industry's 10.4% in FY2012 on the back of strong loans contributions by both CFS and GB.
- Mortgage loans, which formed 44.8% of domestic consumer loans, expanded 15.2% in FY2012 despite the tighter financing guidelines introduced in 2012. Our mortgage loans market share continued to increase to 13.4% in December 2012 from 13.2% a year earlier.
- Automobile financing grew steadily at 12.9% and continued to lead the market with a 20.2% market share as compared to 19.2% in the preceding year.
- Business banking and SME segment loans grew 5.0%, and are expected to benefit further from the operational improvements made at branches to serve this segment more effectively going forward.
* CY2011 based on unaudited figures
Deposits Growth
| FY2012 | CY2011 | YoY | |
|---|---|---|---|
| Malaysia (RM billion) | 227.3 | 209.5 | 8.5% |
| Savings Deposits | 35.5 | 32.9 | 8.0% |
| Current Accounts | 56.9 | 47.5 | 19.6% |
| Fixed Deposits | 114.6 | 103.2 | 11.1% |
| Others | 20.3 | 25.9 | -27.5% |
| Singapore (SGD billion) | 29.9 | 26.5 | 12.7% |
| Savings Deposits | 3.3 | 2.9 | 11.4% |
| Current Accounts | 2.9 | 2.8 | 3.8% |
| Fixed Deposits | 23.1 | 20.2 | 14.3% |
| Others | 0.6 | 0.6 | 5.6% |
| Indonesia (Rp trillion) | 86.1 | 70.4 | 22.3% |
| Savings Deposits | 18.8 | 17.6 | 6.7% |
| Current Accounts | 14.7 | 12.4 | 18.6% |
| Fixed Deposits | 52.6 | 40.4 | 30.2% |
| Group Gross Deposits (RM billion) | 347.2 | 314.7 | 10.3% |
- The Group's customer deposits grew by 10.3% to RM347.2 billion as at the end of 2012. Domestic operations deposits registered a healthy growth of 8.5% while Singapore and Indonesian operations registered a much higher growth of 12.7% and 22.3% respectively.
- In Malaysia, the strongest growth came from current accounts which expanded 19.6% during the year, while in Singapore stronger growth came from savings deposits and fixed deposits. In Indonesia, where the Group continues to strengthen its network, deposit origination improved on the back of current accounts and fixed deposits, which expanded 18.6% and 30.2% respectively.
- The loans-to-deposits ratio for the Group rose to 89.8% as at December 2012 from 87.8% a year before, but still remains within the Group threshold of 90%.
- The Group continued to prioritise growing its low cost of funds through various strategies which resulted in our Current Account Savings Account (CASA) ratio strengthening to 35.1% in December 2012 as compared to 33.6% in December 2011.
Pursuing profitable and responsible growth
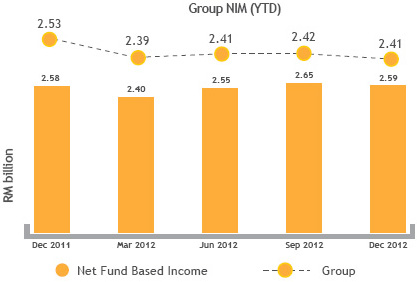
* CY2011 based on unaudited figures
- Net interest margin (NIM) for the Group dropped to 2.41% from 2.53% in 2011. However NIM stabilised in the 3rd and 4th quarter of 2012. Factors contributing to NIM compression were reversal of unwinding interest, changes on the amortisation of selected fees and margin compression due to competition from lower loan pricing and higher deposit costs.
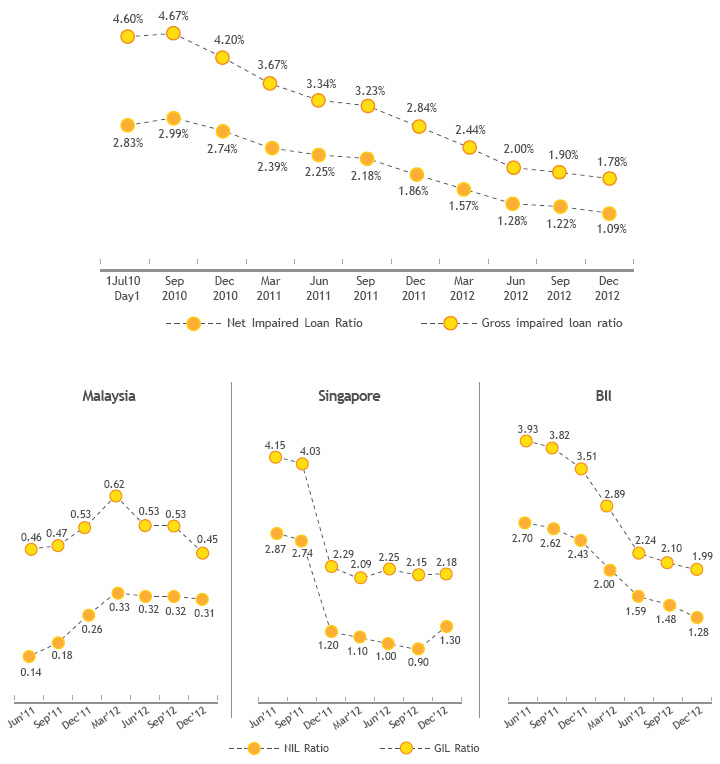
- Since September 2010, asset quality has continued to improve despite the more stringent criteria adopted for impaired loans with the implementation of FRS 139.
- Net impaired loans declined further to 1.09% as at December 2012 compared to 1.86% in December 2011. The Group's net credit charge-off rate was 23 bps for the full year.
- Loans loss coverage improved to 105.6% from 86.9% a year ago.
Asset quality continued to improve as the Gross Impaired Loan ratio dropped below 2.0%
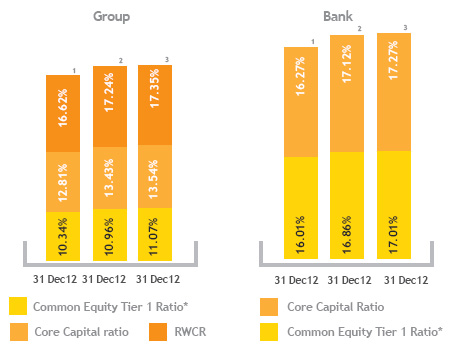
Capital adequacy remained strong
- The Group's capital ratios, comprising core capital ratio (CCR) and risk-weighted capital ratio (RWCR) remained strong at 13.43% and 17.24% respectively (based on 85% reinvestment rate).
- The Group seeks to maintain adequate levels of capital and an optimum mix of the different components of capital in order to support the underlying risks of the Group's business, to optimise growth and to withstand capital demands under market shocks and stress conditions.
- Full electable portion paid in cash
- Assuming 85% reinvestment rate
- Full electable portion reinvested
Note:
^ Core Capital Ratio and Risk Weighted Capital Ratio are computed based on Basel II requirements under BNM.
* Common Equity Tier 1 ("CET1") Ratio computation is based on transitional arrangements according to BNM's guideline issued on 28 November 2012.
Capital-raising exercise
The Group undertook the following capital-raising exercises during FY2012:
| Capital redemption | : | RM1.5 billion 10NC5 sub debt |
| : | RM0.9 billion (USD300 million) 10NC5 sukuk | |
| Capital prepaid | : | RM3.1 billion sub term loan |
| Capital raising (equity) | : | RM3.66 billion (via private placement) |
| Capital raising (sub debt) | : | RM4.8 billion (include RM2.1 billion 12NC7, USD800 million 10NC5 and IDR1 trillion due in 2019 raised by BII) |
Key Ratios
| FY2012 | CY2011 | |
|---|---|---|
| Net Interest Margin (bps) | 2.41 | 2.53 |
| Return on Equity (%) | 16.0 | 15.7 |
| Fee to Income Ratio (%) | 38.7 | 38.0 |
| Cost to Income# (%) | 48.6 | 49.9 |
| Loan-to-Deposit Ratio (%) | 89.8 | 87.8 |
| Asset Quality | ||
| Gross NPL or Impaired Loan Ratio (%) | 1.78 | 2.84 |
| Net NPL or Impaired Loan Ratio (%) | 1.09 | 1.86 |
| Loan Loss Coverage (%) | 105.6 | 86.9 |
| Charge off rate (bps) | 23 | 20 |
| Capital Adequacy (Group)^ | ||
| Core Capital Ratio (%) | 13.43 | 11.57 |
| Risk Weighted Capital Ratio (%) | 17.24 | 16.29 |
Note:
# Total cost excludes amortisation of intangibles for BII and Kim Eng
^ Adjusted for dividend payment and reinvestment made under the Dividend Reinvestment Plan (DRP)
* CY2011 based on unaudited figures
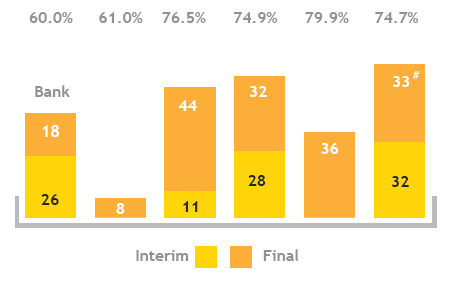
Consistently rewarding shareholders with high dividend payout ratio
- A final dividend of 18 sen per share less 25% taxation and 15 sen single-tier dividend have been proposed by the Board of Directors to be distributed to eligible shareholders. The proposed gross dividend comprising of cash portion of 4 sen singletier dividend per ordinary share to be paid in cash and an electable portion of 29 sen (24.5 sen net per share) per ordinary share, where the electable portion comprises of 11 sen single-tier dividend and 18 sen franked dividend (net 13.5 sen).
- If approved, the total gross dividend for FY2012 of 65 sen per share is equivalent to a payout ratio of 74.7% which remains well above the 40-60% payout policy.
- Note:
- * Reinvestment rate for the Dividend Reinvestment Plan.
- ** adjusted for 1:4 Bonus Issue in February 2008 and 9:20 Rights Issue at RM2.74 in March 2009.
- # The Net Dividend is 28.5 sen of which 15 sen is single-tier dividend.
Conclusion
- The Group posted a robust financial performance in 2012 on the back of our regional strategy and continued strength in the Malaysian market, both in household and non-household financing.
- The acquisition of Kim Eng has elevated our GB offering, and this was a key source of fee-based income for the Group in 2012. As we progress into 2013, we see this strengthening further as we continue to regionalise our GB business segment.
- A strong balance sheet, coupled with sound risk management practices has ensured that our asset quality and other operating fundamentals continue to remain resilient. And on the strength of a proactive capital management strategy, we are in a position to comply with the Basel III capital adequacy requirements in 2013.
- Maybank will remain focused on growing profitably and responsibly in Malaysia and internationally and will continue to adopt a disciplined approach cost management to ensure better efficiencies Groupwide.